Plot for mdecomp function
Usage
# S3 method for class 'mdecomp'
plot(x, return.data = FALSE, ...)
Arguments
- x
A result of age and cause decomposition from
mdecomp().- return.data
Should the data be returned (
TRUE) or the ggplot2 plot (default,FALSE).- ...
Ignored.
Value
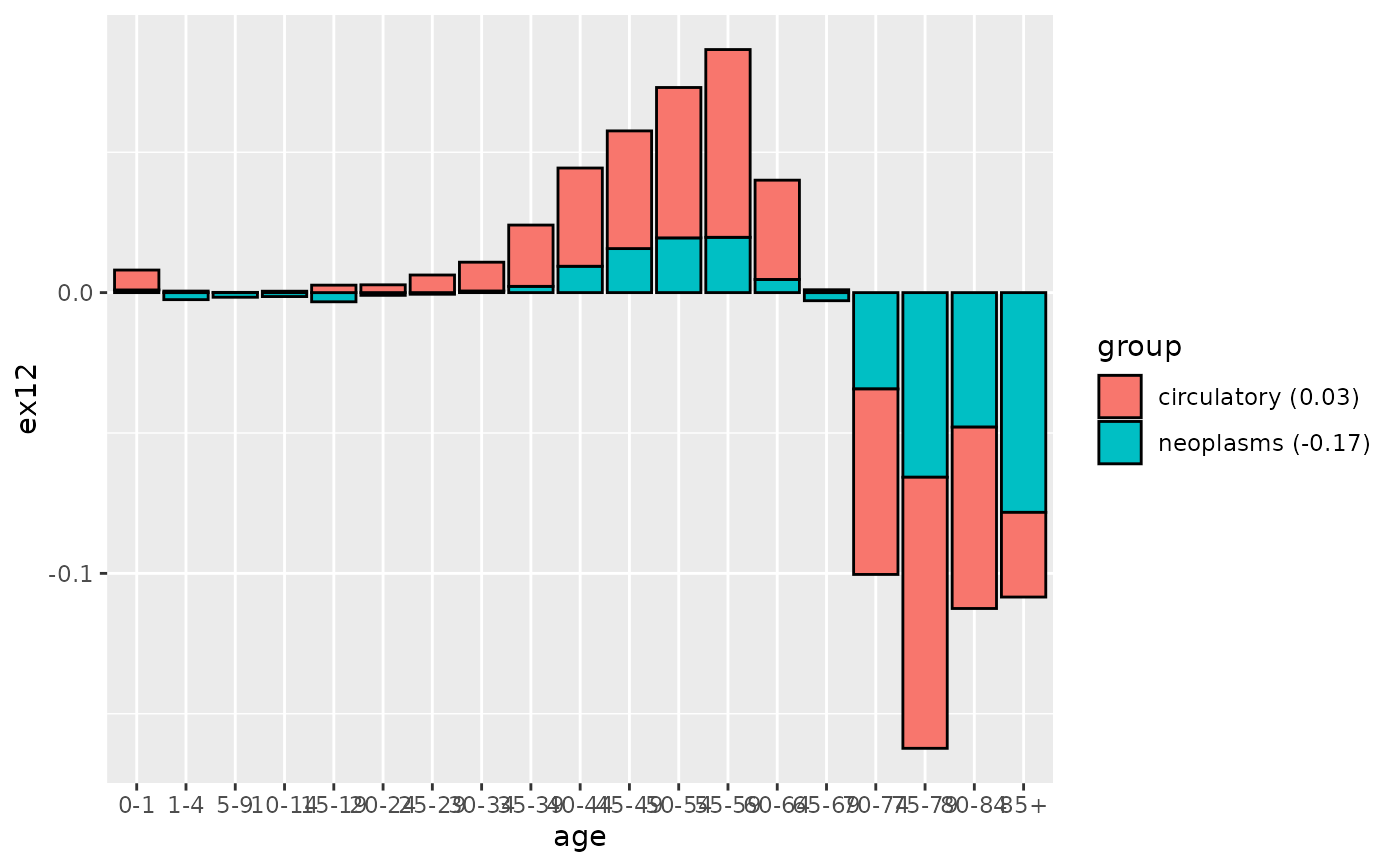
If return.data = FALSE, a ggplot2 object with stacked bars of
age- and cause-specific contributions. If return.data = TRUE, a data
frame with columns age, ex12, and group used to build the plot.
Examples
data(mdecompex)
usa <- subset(mdecompex, cnt == "usa")
eng <- subset(mdecompex, cnt == "eng")
dec <- mdecomp(
  mx1 = list(
    all = usa$all,
    neoplasms = usa$neoplasms,
    circulatory = usa$circulatory
  ),
  mx2 = list(
    all = eng$all,
    neoplasms = eng$neoplasms,
    circulatory = eng$circulatory
  ),
  age = usa$age
)
plot(dec)