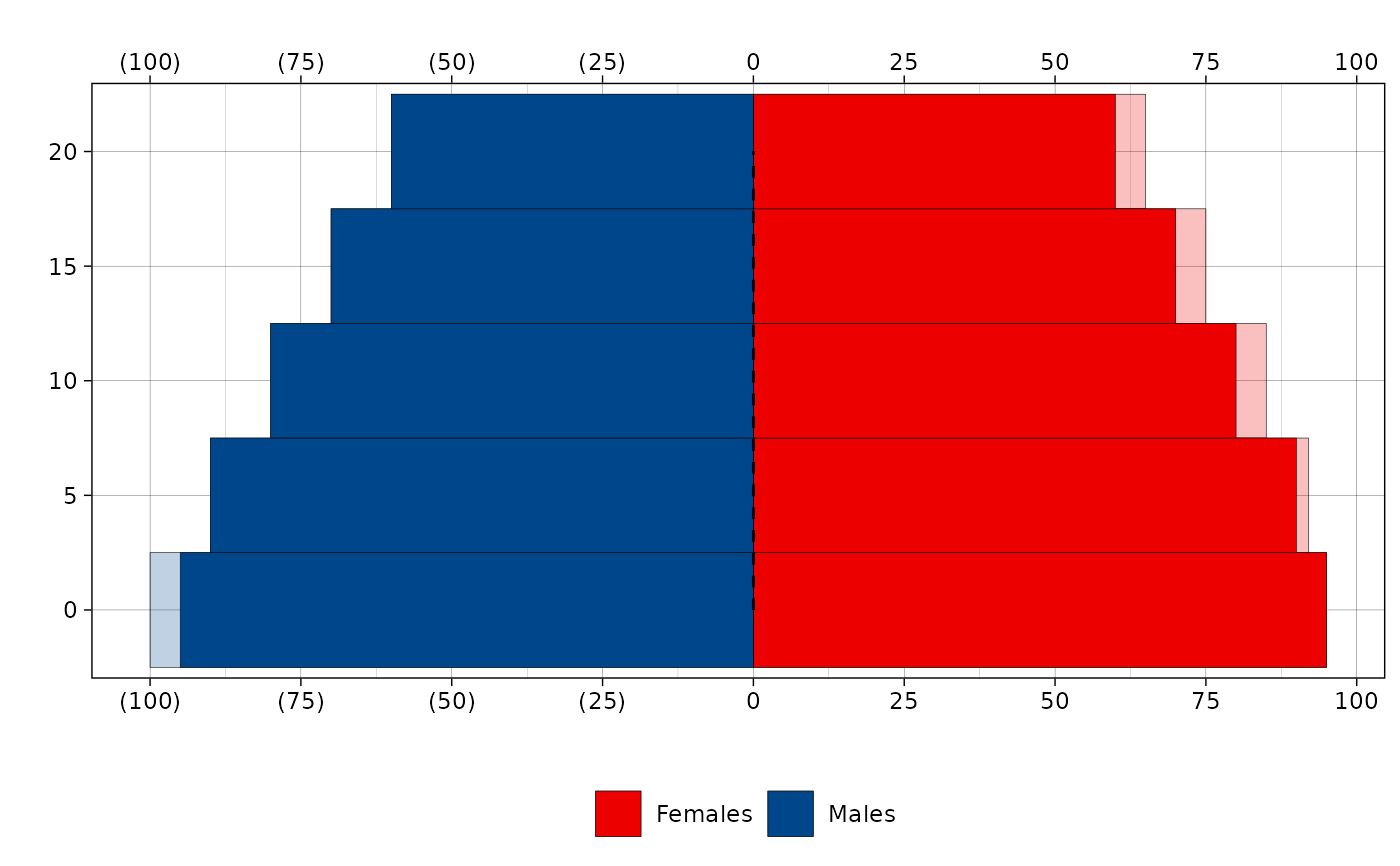
Plot population pyramid
Arguments
- popm
Numeric vector of male population
- popf
Numeric vector of female population
- popm2
Optional. Numeric vector of second male population to be plotted as line.
- popf2
Optional. Numeric vector of second female population to be plotted as line.
- age
Numeric vector of ages
- prc
Should the population be shown as a percentage rather than in absolute terms? By default, it is
FALSEand the plot shows user-specific values inpopmandpopf.- sexn
Character array of labels for the sexes. By default =
c("Males", "Females")- sexc
Character array of colors for the sexes. By default =
c("#ED0000B2","#00468BB2"), which are red and blue- age.cont
Optional. Logical. Should the age axis be considered as continuous scale? Recommend to switch to
TRUEif the age intervals are small (1 year) andFALSEotherwise (for ex., when age interval is 5 years). By default function chooses the value by itself.- un.intervals
Logical. Should the age groups be unified? For example, if the first and second groups are 0-1, 1-4, and all other groups are five-year, the function automatically makes the group 1-4 to make all the intervals the same. By default,
TRUE.